By Jim Stanford | Part of our Special Series: Always Canada. Never 51. | This post first appeared in Policy Options.
Some business and political commentators cite a growing gap between the per capita GDP of Canada and the U.S. as evidence of Canada’s purported economic dysfunction. Some even conclude that because of stagnating per capita GDP, Canada is now poorer than Alabama – a state with widespread poverty, low incomes and short life expectancy.
This far-fetched conclusion reflects deep flaws in the use of per capita GDP as a measure of prosperity and living standards. As explained in the first part of this commentary, GDP per capita measures total output produced (for money) in a country relative to its population.
However, this simple ratio ignores important issues such as what is included in GDP, who owns it and how it is distributed. International comparisons are further complicated by necessary adjustments for exchange rates, price levels and population estimates.
Comparing GDP per capita between Canada and the U.S. is especially fraught because of other methodological problems. For example, the much larger proportion of unauthorized immigrants living in the U.S. artificially boosts its apparent per capita GDP. There are an estimated 11 million people there who contribute to the numerator (GDP) but are not counted in the denominator (population).
Similarly, per capita GDP ignores the value of time. In 2023, the average employed American worked 114 hours longer than the average employed Canadian – about three weeks more of full-time work.
American working hours are among the longest of any OECD country because low wages compel many of them to work extra hours or even second jobs and because there are no legal requirements for paid vacation. Those longer working hours account for much of the Canada-U.S. gap in GDP per capita.
Another issue is the failure to consider the environmental effects of economic production. Conventional GDP statistics take no account of the costs of pollution. America produces more output per person, but takes fewer measures to protect the environment, which obviously affects the quality of life of current and future generations. Like time, nature is not free.
These methodological issues cast considerable doubt on the validity of simplistic Canada-U.S. comparisons.
Attention to Canada’s per capita GDP has grown during the current federal election campaign. However, it is important to view the issue through a long-term lens. Canada’s per capita GDP has been sliding relative to the U.S. since the early 1980s. The following figure portrays the ratio, based on OECD estimates.
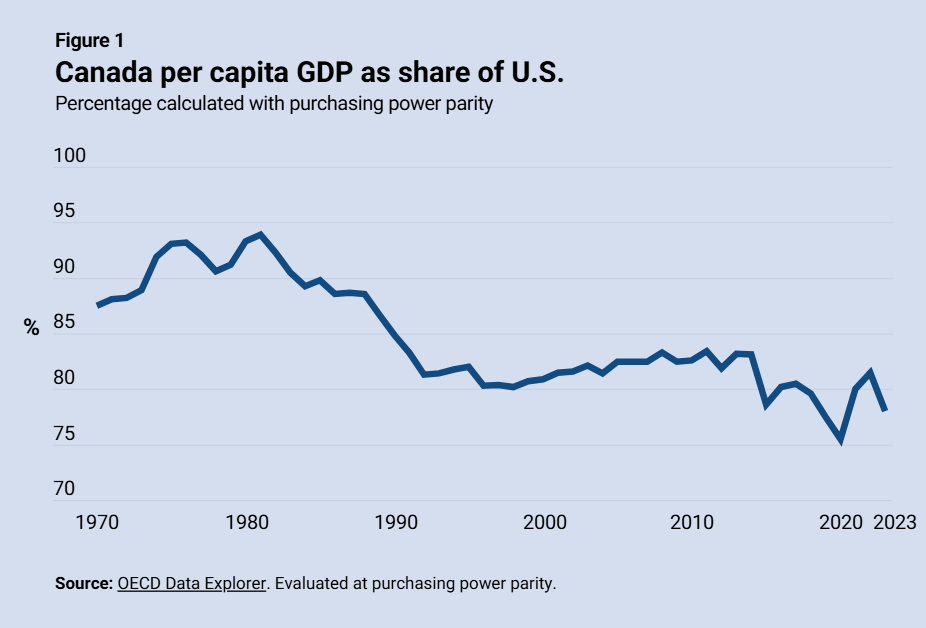
Thanks to rapid industrialization, Canada largely closed the long-standing disadvantage versus the U.S. from 1950 through 1980. Relative per capita GDP peaked in 1981 at 94 per cent of the U.S. level. It then fell rapidly during the 1980s and early 1990s, to just 81 per cent by 1992. It partially recovered in the late 1990s and 2000s but then fell again in the 2010s.
After fluctuating during the COVID-19 pandemic, Canada’s per capita GDP had fallen by 2023 to 78 per cent of U.S. levels.
Data and politics
There is a natural tendency to put a political spin on economic measurements. However, there is no correlation between which party is in power in Ottawa and the evolution of this ratio.
Canada’s per capita GDP relative to the U.S. rose during Pierre Elliott Trudeau’s first years in office but began to fall during his final term. It declined most steeply under Brian Mulroney, was stable during the terms of Jean Chrétien and Paul Martin, fell during the last years of Stephen Harper’s rule and then declined further under Justin Trudeau.
Canada-U.S. per capita GDP comparisons reflect a complex mix of many determinants, including economic growth, sectoral changes, population growth, immigration, inflation and exchange rates. It is far-fetched to conclude that any government deserves either credit or blame for its trajectory.
Prosperity depends not just on how much is produced, but how it is distributed. Bank of Canada research shows most of the U.S. advantage in per capita GDP is concentrated among high income earners.
Three-quarters of the gap in per capita output is captured by higher incomes for the top 10 per cent of Americans. There is little difference in incomes between the bottom 90 per cent in the two countries. The richest 10 per cent of Americans receive almost half of all pre-tax income, so their wealth significantly inflates the overall per capita average.
In fact, most Canadian workers earn higher wages than those in the U.S. It is most accurate to measure typical incomes by the median wage (the halfway point in a distribution), not the average (which can be distorted by very high incomes at the top).
The median hourly wage in Canada in 2023 was C$28.79 or US$24.61 at the OECD’s purchasing power parity exchange rate. The median hourly wage in the U.S. in 2023 was US$23.11. The typical Canadian worker thus earned 6.5 per cent more than their U.S. counterpart, despite lower per capita GDP.
Perhaps surprisingly, the Canadian worker also paid a lower marginal federal tax rate (20.5 per cent for full-time workers) than their U.S. counterpart (22 per cent).
Of course, public services, not just private incomes, are also important to living standards. Canada’s more extensive health care, public education and other services enhance the quality of life in ways not captured by per capita GDP.
For example, eight per cent of Americans have no health insurance and one-quarter are underinsured (facing out-of-pocket costs that force many to skip needed care). That takes much of the shine off a higher GDP.
For all these reasons, it is clear the typical Canadian has a higher standard of living than the typical American. We are healthier, live three years longer, face much less inequality and are happier. These outcomes are not accidents. They reflect deliberate policy choices (including regulation, taxes and public programs) that shape both production and distribution to improve well-being.
The decade is not lost
In that light, Canada has continued to make progress in recent years – contrary to claims we have suffered a lost decade.
For example, the poverty rate (as defined by Statistics Canada’s market basket measure) fell by one-third between 2015 and 2022. Average real hourly wages (after inflation) are nine per cent higher than a decade ago, despite post-COVID inflation. The average unemployment rate was lower over the last decade than the previous decade.
The United Nations human development index (HDI) confirms Canada’s success in converting economic activity into well-being. It attempts to directly measure living standards, rather than relying on per capita GDP to evaluate well-being. The HDI considers three components: per capita gross national income (GNI), life expectancy (a proxy for health) and education.
Canada ranked 18th on the latest HDI scorecard, three places ahead of the U.S. Our human development has improved more than twice as fast since 2010 as the U.S. We rank eight places higher on HDI than we do on GNI per capita – confirming we efficiently improve human welfare with our economic resources. In contrast, the U.S. ranks 11 places lower on HDI than GNI, a bigger negative gap than any other developed country.
In sum, per capita GDP is a deeply flawed measure that says little about real-world living standards. To be sure, Canada has much to improve in its economy: not only to produce more but also to produce it more sustainably and use it more effectively to improve human and social conditions.
Nevertheless, the typical Canadian lives better than the typical American across a wide range of tangible indicators. Living standards for most Canadians have improved over the last decade, not cratered. We should not be misled by one flawed, abstract measure into believing that Canada is somehow an economic basket case.
—
This is part 2 of a 2-part analysis of Canada’s GDP per capita. Part 1 can be found here. This article originally appeared in Policy Options. It is republished here under a Creative Commons license.
🎥 Plus, view Social Capital Partners’ video: Is Canada really poorer than Alabama?
Share with a friend
Related reading

Why Canada should back employee ownership trusts for the long term | TheFutureEconomy.ca
Established in 2024, Employee Ownership Trusts (EOTs) allow business owners to sell their companies to a trust held on behalf of employees, keeping firms in Canadian hands, building worker wealth and strengthening local communities. Jon Shell makes the case for EOTs in TheFutureEconomy.ca. With a temporary capital gains tax exemption set to expire in 2026, he and other advocates are urging the federal government to make the incentive permanent before momentum stalls.

How Employee Ownership Trusts keep wealth in Canada | Canadian Business
The coming wave of business successions will shape Canada’s economy for generations. In Canadian Business, Jon Shell explains how employee ownership safeguards economic sovereignty, while boosting growth, productivity and local wealth, giving employees struggling with affordability a new source of income. As entrepreneurs and owners seek alternatives to selling abroad, the employee ownership trust (EOT) provides a practical answer. Instead of letting the EOT tax incentive expire at the end of 2026, now is the time for the government to double down on employee ownership.
A housing boom isn’t a win for wealth equality and here’s why
Canada's wealth gap appeared to narrow between 2019 and 2023 and we set out to make sense of this. SCP's Director of Policy Dan Skilleter, the lead author on our 2024 Billionaire Blindspot report, connected with sector colleagues working on wealth concentration and dug into all the best available data. What he found was that the dip was largely a mirage, driven by a pandemic housing boom that temporarily inflated the one asset ordinary Canadians hold: their home. Meanwhile, these soaring prices locked out an entire generation from building wealth altogether.