I published Billionaire Blindspot in 2024 to draw attention to the poor state of wealth inequality data in Canada and to dispel the intuition Canadians have that we are a much more egalitarian society than our U.S. neighbours. In putting it together, I couldn’t draw on a lot of recent research in the Canadian wealth inequality space because, well, it didn’t exist.
Since then, we’ve witnessed something of a renaissance in the wealth inequality discourse, with great contributions by Alex Hempel, Silas Xuereb and Alex Hemingway, updates from the Office of the Parliamentary Budget Officer (PBO) and an exciting attempt at a new methodology by StatsCan to ascertain how much of our nation’s wealth is held by the very richest families.
These reports are often in conversation with one another, debating methodology and assumptions. I don’t always have much to contribute to those debates; I am mostly just glad to see they’re taking place.
But there’s one finding that’s stuck with me I’ve been wanting to explore in more in depth: the reported decline in wealth concentration of the richest families between 2016-2023, observed by Silas and Alex in The new robber barons: A quarter century of wealth concentration in Canada.
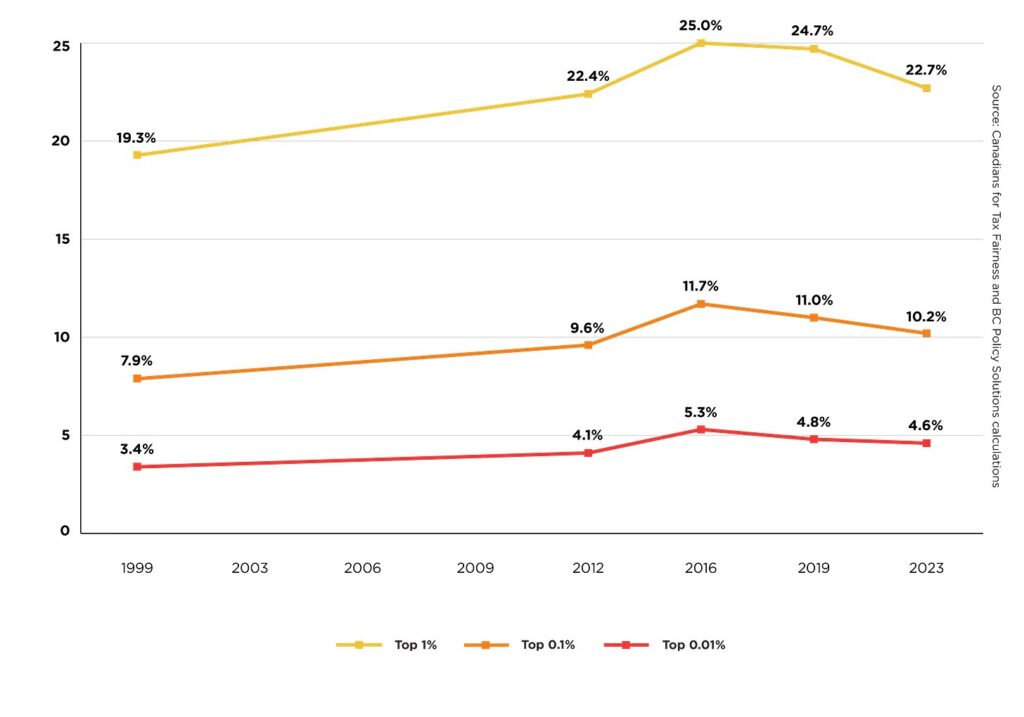
As you can see in their graph, there’s a noticeable dip in the last two data points correlating to 2019 and 2023. On first glance, it looks like the rich got a bit less rich, but that doesn’t really make sense when taken against other trends and measures in our economy. So, what’s going on here? Silas and Alex have a theory, and I think they’re on to something:
“… Another indicator is the trajectory of housing prices. During the pandemic, housing prices increased drastically, inflating wealth for many homeowners. Housing prices began to flatten in 2022 and were actually lower in July 2025 than they were in July 2023, suggesting that the wealth of most households has increased little over this period compared to the rising wealth of billionaires, which is mostly financial wealth,” they write.
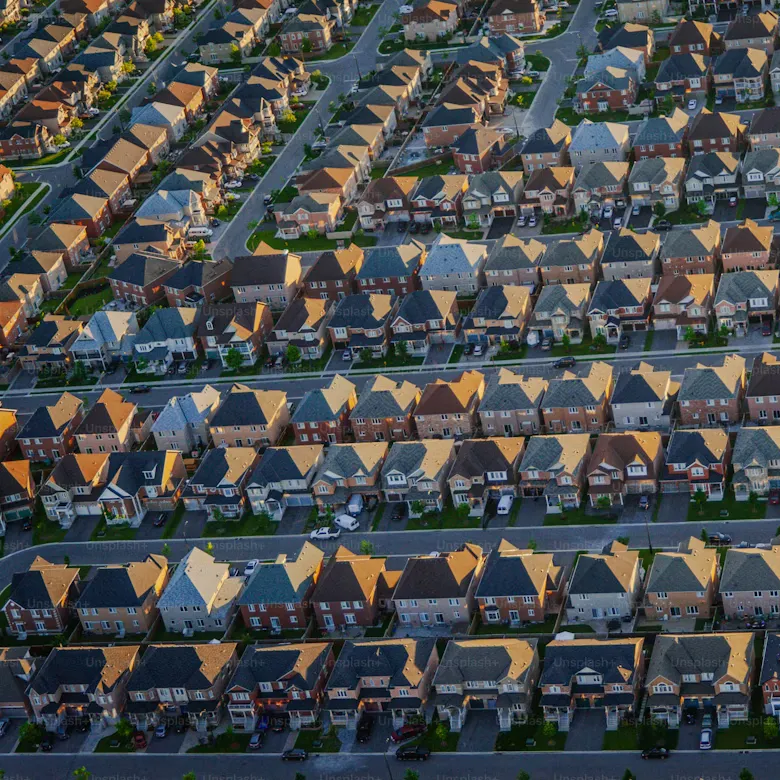
To understand what’s actually driving the dip, you need to start with what each group holds. As they point out, typical Canadian families hold the vast majority of their wealth in one asset: their home. The ultra-wealthy hold most of theirs in financial assets like equity in private and public companies. Typically, the financial assets of the wealthy significantly outperform those of ordinary Canadians – which is how we get runaway inequality. During the pandemic years, we witnessed something very unusual instead.
During the pandemic housing boom, national average home prices surged from roughly $504,000 in early 2020 to a record $816,720 in February 2022, according to CREA — a gain of approximately 62% in under two years. Over roughly the same period, Canadian billionaire wealth grew by about 57%, according to Oxfam Canada. For a brief and unusual window, ordinary Canadian homeowners roughly kept pace with — and by some measures outpaced — billionaires!
That role reversal, very rare by any historical measure, is almost certainly what drove the richest families’ share of total wealth temporarily downward. Again, their total wealth didn’t go down, but their proportion of all the wealth in Canada, compared to other groups, did.
Here is where the story gets more complicated. The underlying data for Silas and Alex’s chart comes from Statistics Canada’s Survey of Financial Security (SFS), which runs periodically. According to Statistics Canada’s documentation, the 2019 survey ran September to December under the standard collection window, while the 2023 survey ran April 21 to August 31—an earlier-than-usual window adopted following changes made during the pandemic. This means the height of the housing boom—the surge to $816,720 and subsequent softening—happened entirely in between the two survey periods. No SFS survey captured the peak at all. The dip Silas and Alex observe is therefore real, but it’s measuring the echoes of the boom rather than the boom itself, and it almost certainly understates how dramatically the richest families’ share of total wealth shrank at the actual peak.
There’s a second methodological wrinkle worth flagging that mitigates the significance of the first. The SFS doesn’t use assessed or appraised values for housing. Rather, it asks respondents a single question: “How much would this property sell for today?” StatsCan itself acknowledges that this self-assessment is “subject to a large variance.” Research consistently finds that homeowners overestimate their home values on average, and that price volatility makes accuracy worse, with homeowners specifically tending to overestimate when local prices have recently fallen. The spring and summer of 2023, when the survey was in the field, was exactly that environment: a market that had dropped sharply from its 2022 peak, but with respondents who had spent two years watching neighbours sell for outrageous sums. The anchoring effect of those boom-era prices on self-reported valuations was likely substantial, meaning the 2023 SFS housing wealth figures are probably somewhat overstated relative to where the market had actually settled. The dip in Silas and Alex’s chart may be partly a measurement artifact as much as a real economic phenomenon.
None of this invalidates their finding—the PBO independently confirmed the drop in the richest families’ share of total wealth from 2019 to 2023 is statistically significant but they were using the same SFS data as Silas and Alex did as their baseline. What this does suggest is that the magnitude of the dip, even measured after house prices had already fallen significantly from their 2022 highs, is smaller than the chart implies—and the wealthy are already pulling ahead again. As Silas and Alex themselves note, between July 2023 and July 2025, Canadian billionaire wealth grew 37.2% while total household wealth grew only 9.3%.
Normally, a dip in the richest families’ share of total wealth would be welcome news. But when I look under the hood at what drove this one, I find it hard to celebrate. It was built on a housing boom that temporarily inflated the one asset ordinary Canadians hold. More importantly, the same price surge that temporarily gave ordinary homeowners a larger slice of the pie was a central driver of the housing affordability crisis that has structurally reshaped who can and can’t build wealth in Canada.
For younger Canadians already squeezed by the cost of living, the pandemic housing boom wasn’t a wealth transfer in their direction. It priced them out of the primary vehicle through which most ordinary Canadians accumulate wealth, not to mention a key ingredient most of them seek to feel economically secure and start a family.
A temporary blip in wealth concentration driven by a housing boom that comes at the cost of the next generation’s economic future isn’t progress.
Share with a friend
Related reading

New research on the Big Banks and the businesses left behind
The productivity, resilience, inclusive growth and economic sovereignty objectives Canada is trying to achieve are not independent of its financing system. Canada ranks second-worst in the G7 as a place to be an entrepreneur, with 55 per cent of small-business owners saying they would not recommend starting a business here right now. A new SCP report by Michelle Arnold argues that this is not a reflection of the limits of our entrepreneurs, but the limits of our lenders - when it comes to SME financing, what the Big Banks can do is limited by how they're structured. If we want a stronger economy that works for workers, communities and small businesses, we need a financial system diverse enough to serve them.
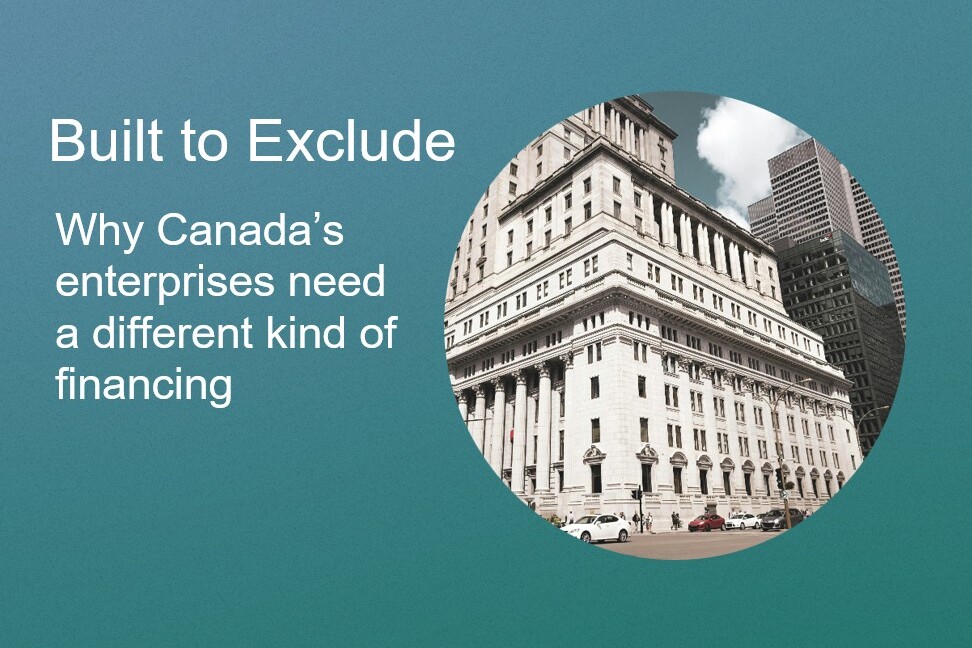
Built to Exclude: Why Canada’s enterprises need a different kind of financing | Report
Canada's enterprise financing system is dominated by big banks that control 93% of banking assets and nearly 80% of SME lending. While stable and respected, they have structural constraints—minimum deal sizes, rigid credit models, collateral requirements—that systematically stop them from lending to a range of viable businesses. The SMEs left behind include businesses looking for small loans, seasonal enterprises, non-profits, cooperatives and rural firms. If we continue to undercapitalize SMEs trying to get off the ground or grow, this will have cascading economic and social consequences. Canada needs alternative financing institutions that operate alongside commercial banking as permanent, scaled infrastructure.

👏 Letting the big W sink in
In the Spring Economic Update, the federal government moved to make the legislative structure and tax incentive for Employee Ownership Trusts (EOTs) permanent. This is amazing news! At Social Capital Partners, we are grateful that the government has made these changes. Thanks to Prime Minister Mark Carney, François-Philippe Champagne and Ryan Turnbull for understanding the importance of employee ownership. This and more all in one funny-but-factual biweekly read.