
Economic growth is often treated as a shorthand for progress. As the old story goes, if our Gross Domestic Product (GDP) goes up, then we’re all better off.
But the latest World Inequality Report offers another sobering reminder that who benefits from economic growth matters just as much as how much the economy has grown. And the economic order keeps tilting further and further towards serving a tiny, ultra-wealthy minority.
This is why the World Inequality Database (WID) and this flagship 2026 report matter so much. Launched in 2018, the global effort brings together more than 200 researchers to track income and wealth inequality over time, building a shared global infrastructure to understand—and sometimes even expose—trends that were previously hidden or fragmented.
Canada is a part of this global network of experts, which is vital—because, as we have said in our own 2024 Billionaire Blindspot report, you can’t fix what you can’t see.
The most important new finding is that today’s inequality story is not primarily about the richest 10%, or even the richest 1%. It’s about what’s happening at the very top of the wealth distribution.
Globally, the richest 0.001%—think of them as roughly 60,000 people, or the world’s billionaires, or how many people can fit in a football stadium—have dramatically increased their share of total wealth.
In 1995, this group held about 3.8% of global wealth, but by 2025, that share had climbed to 6.1%. Over the same period, their personal wealth also grew at annual rates between 2% and 8.5%, far outpacing the bottom half of the population, whose wealth grew at just 2% to 4% per year.
When policy debates focus on “the rich” as a broad category, they miss the fact that most of the action is concentrated among a very small number of families (and tech bros) at the extreme top. Looking only at the top 10% or top 1% risks obscuring the true scale—and drivers—of wealth concentration.
Why does this matter? The evidence is overwhelming that growth that produces extreme inequality leads to less resilient, less healthy and less prosperous societies. And economic inequality drives prices and asset values out of reach, depriving ordinary working people from access to goods and services.
It also entrenches power.
“The result is a world in which a tiny minority commands unprecedented financial power, while billions remain excluded from even basic economic stability,” the authors, led by Ricardo Gómez-Carrera of the Paris School of Economics, write.
In Canada, too, although Canada’s GDP keeps going up, wealth gains have been concentrated at the very top. Many Canadian households are struggling to afford food and housing.
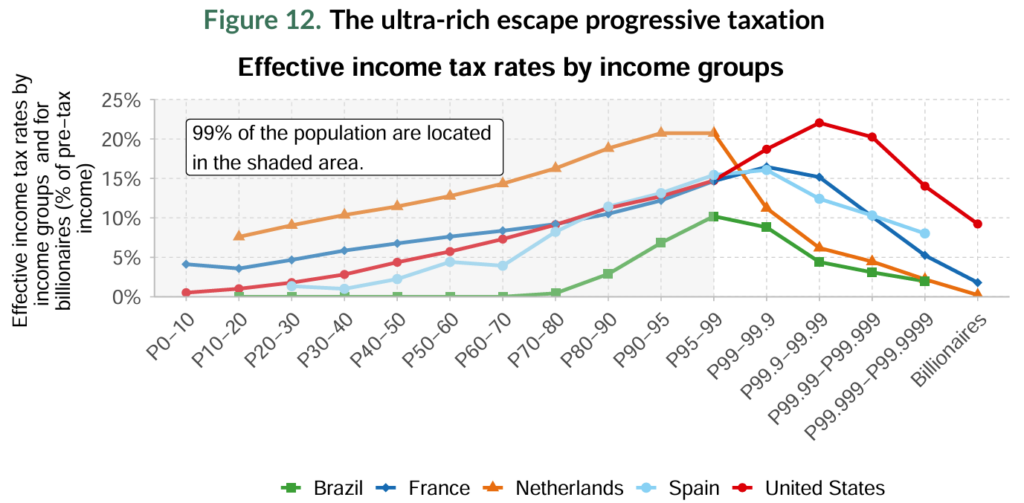
As our colleagues at the Canadian Tax Observatory have also pointed out, one key factor is taxation—or more precisely, who governments are willing or able to tax. International data in the report show a striking pattern: at the very highest income levels, effective tax rates actually decline (see Figure 12 from the report, below). In other words, the ultra-rich often pay lower effective tax rates than those who are merely “rich,” and in some cases, even lower than middle-income earners.
Canada-specific data at this level are notoriously hard to come by, but SCP’s own research suggests a similar dynamic. The wealthiest Canadians increasingly derive their income from capital gains, rather than wages, which are taxed at a lower rate. Our tax system, while containing many progressive elements, actually exacerbates the problem of growing wealth inequality. Because of tax breaks for capital gains and dividends, tax rates on income derived from wealth are lower than those on income derived from working. And that’s before even considering the kinds of sophisticated tax-planning and wealth sheltering strategies that only the wealthy tend to have access to.
The report ranks countries based on the number of data sources they use to measure wealth inequality and Canada sits in the middle of the pack—behind the U.S. and much of Western Europe in terms of transparency and data coverage.
Without high-quality data, policymakers are left debating inequality in the dark. The one-page country profiles in the World Inequality Report are short, but the Canadian profile is revealing. The report’s estimates show greater wealth concentration than the most recent Canadian Parliamentary Budget Officer (PBO) figures based on “rich lists.” For example, the report estimates that the top 1% in Canada hold about 29.3% of total wealth, compared to 23.8% in the PBO’s analysis.
Momentum is building in Canada for better wealth data. Statistics Canada recently released its first serious attempt at improving measurement of wealth at the top—something SCP has long called for. It’s a promising step toward shedding light on Canada’s billionaire blindspot.
The deeper challenge is policy. As Canada faces an unprecedented economic assault from the south, there is a risk that the policy instruments we deploy to encourage growth will exacerbate inequality. We do not want to encourage growth that sees all the returns go to those who already have extreme wealth. We need to tackle the structural dysfunction within the economy today that sees gains and redistribution flow almost entirely upward.
That means better ways for families and communities to build assets—like affordable housing, business ownership, retirement security and emergency savings—alongside tax and regulatory reforms that ensure fair taxation of the ultra-wealthy.
The World Inequality Report is clear: wealth inequality is not inevitable. It is the result of choices.
And when the richest 10% of the world’s population owns 75% of wealth and the bottom half just 2%, it’s time we choose something different.
Share with a friend
Related reading
Built to Reach: How institutional accountability shapes the reach of financial systems
Canada needs a greater diversity of accountability in financing institutions to reach all our viable enterprises.

How Private Equity Extracts Value From the Economy | The Walrus Talks
SCP Fellow Rachel Wasserman explains how private equity firms are extracting value from Canadian businesses.

Getting capital into local businesses and communities must be part of Canada’s investment strategy
Getting capital into local businesses and communities must be part of Canada's investment strategy.